What Does 'Trending' Actually Mean? How Google Trends Decides What Is Trending Now
A topic can be 'trending' with far fewer searches than an everyday query. How Google Trends measures a spike, what the 0 to 100 score means, how the 4-hour and 24-hour views differ and how to read trends without being misled.
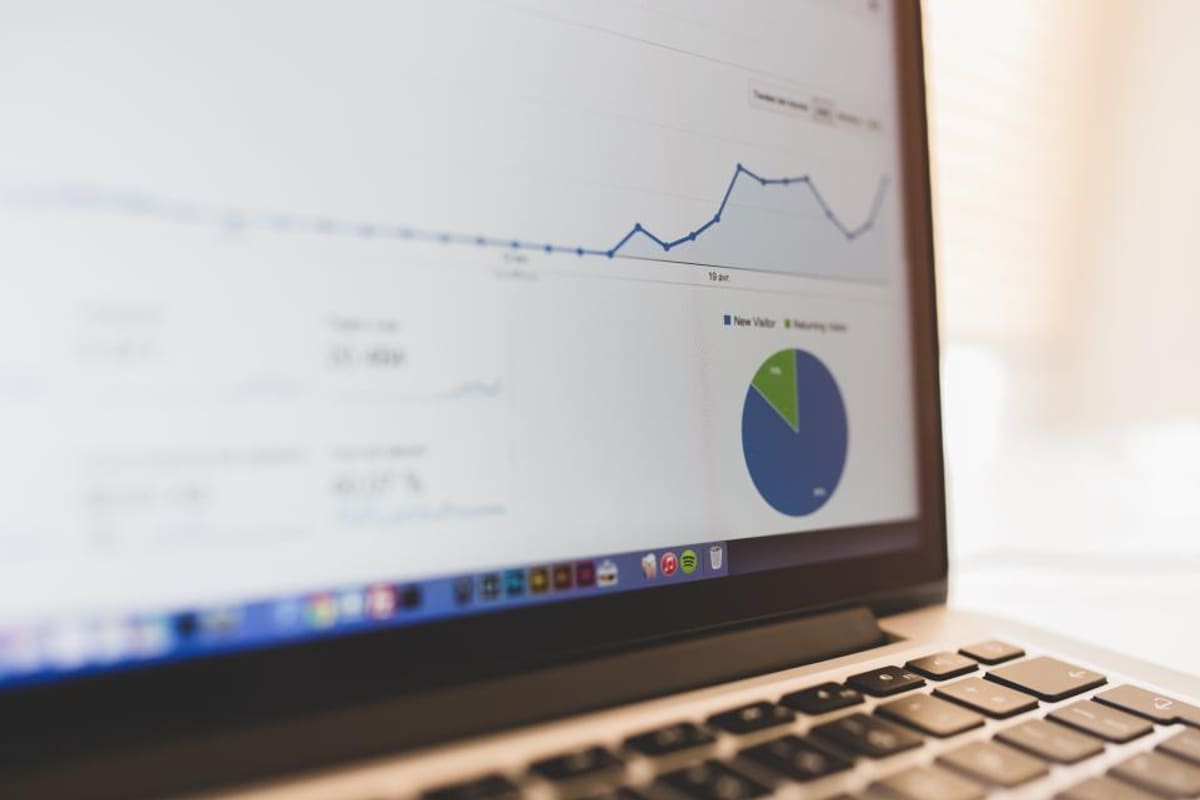
Google Analytics. Photo: Negative Space via stocksnap, CC0.
This site exists to explain what people are searching for, so it is worth being clear about what "trending" means. The word gets used loosely. On Google Trends it has a specific meaning, and understanding it helps you judge whether a trend is a genuine shift or a two-hour blip. It also helps you spot the headlines that use "trending" to mean "we would like you to click".
Trending is about change, not size
A query is trending when it is being searched far more than it normally is. That is a measure of change. It says nothing about absolute size. "Weather" is searched millions of times a day and almost never trends, because that volume is normal. A phrase that usually gets a few hundred searches and suddenly gets fifty thousand will trend strongly, even though it is still a fraction of "weather".
This is why trending lists are full of names, match-ups and product codes you may never have heard of. They are the things that changed, not the things that are biggest.
What the Google Trends score means
Google Trends never shows raw search counts. It shows a relative score from 0 to 100. For whatever topic and time range you are looking at, the point with the most searches is set to 100, and every other point is scaled against it. A 50 means half the interest of the peak; a 25 means a quarter.
Two consequences follow. First, you cannot compare scores across two separate charts, because each chart has its own 100. If you want to compare topics, put them on the same chart. Second, a score of 100 in a quiet week can represent far fewer searches than a 40 in a busy one. The score tells you about shape, not scale.
How Trending Now works
Google's Trending Now page lists topics with the sharpest recent rises for a chosen country. You can filter by how recently a trend started: the past 4 hours, 24 hours, 48 hours or 7 days. The data refreshes roughly every ten minutes, so the 4-hour view in particular changes quickly through the day.
The granularity changes with the window. In the 4-hour view, the chart shows searches almost minute by minute. In the 24-hour view it is grouped into short intervals. The longer the window, the smoother the line and the more a trend has to sustain itself to appear.
Each trending topic also shows an approximate search volume band, such as "20K+" or "200K+", and a percentage rise, which is the best guide to how big the spike really is. A topic at "2K+" and a topic at "500K+" can sit next to each other in the list because both rose sharply; they are not equally important.
What usually causes a spike
Almost every spike traces back to one event with a time attached:
- A scheduled event: a match starts, a film releases, results are declared, a deadline arrives. These are predictable, and the search surge begins hours before.
- A news event: an announcement, an incident, a rumour or a leak. These are unpredictable and spike within minutes.
- A broadcast moment: something said or shown on television or in a viral clip sends people to search for a name they do not recognise.
- A recurring date: Gandhi Jayanti, Navratri, a new OTT release day. These trend every year on cue.
Knowing the cause tells you how long the trend will last. A match spike collapses when the match ends. A product leak can trend for days as new details appear. A festival date trends for a week and then disappears for a year.
How to read a trend without being misled
- Check the volume band, not just the position in the list.
- Open the chart and look at the shape. A single sharp spike that is already falling is a moment; a stepped rise over days is a story.
- Look at the related queries. They tell you what people actually want: a time, a score, a price, a meaning.
- Compare regions. A topic trending in one state because of a local deadline is not a national story.
- Be sceptical of "trending" in a headline with no data behind it. The word is cheap; the chart is not.
Why we write about trends this way
When something trends, most of the people searching have one of a handful of questions: what is it, why now, what happened, what are the details, what should I do. Our trend articles follow that order on purpose, and they say plainly what is confirmed and what is rumour. A trend is an opportunity to inform a lot of people quickly, and it is wasted if the page just repeats the keyword.
Frequently asked questions
Does trending mean most searched?
No. It means searched much more than usual. The most searched terms are stable and rarely appear in trending lists.
What does a Google Trends score of 100 mean?
It is the point of highest interest in the chart you are viewing. All other points are scaled relative to it.
How often does Google Trends update?
Trending Now refreshes about every ten minutes. Longer-term Explore data updates daily.
Can I see trends for just India or just one state?
Yes. Trending Now can be filtered by country, and Explore lets you narrow down to states and cities.
Is Google Trends data exact?
No. It is sampled and normalised. It is reliable for comparing relative interest and spotting changes, not for counting searches.